# Dashboard
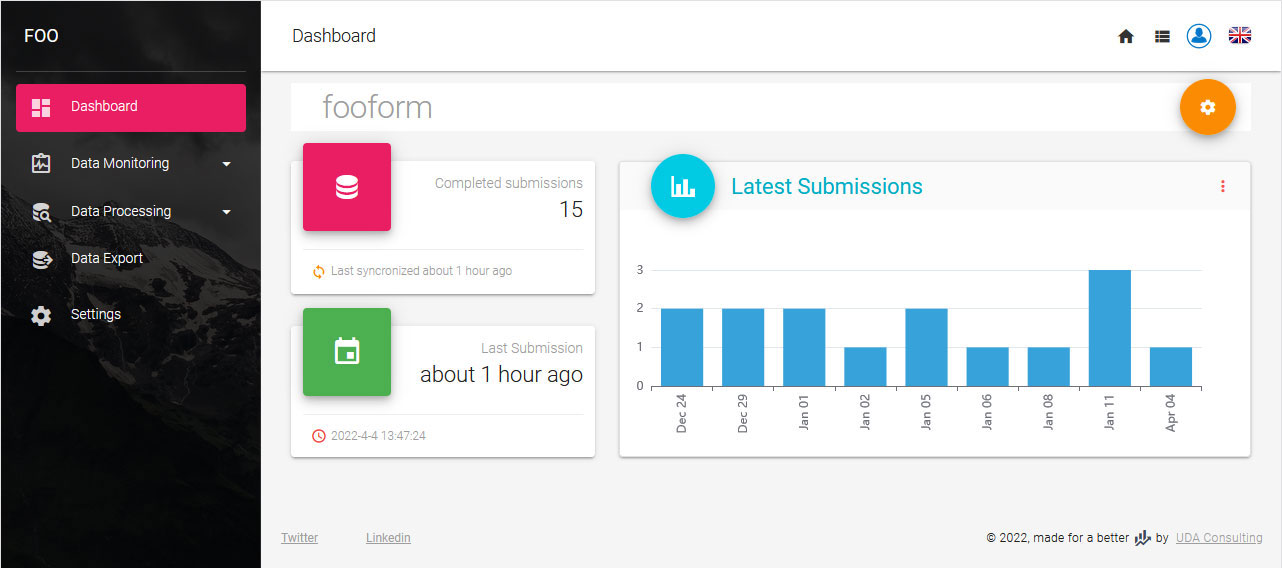
Dashboard will help you to monitor your data collection process. There are three default blocks in dashboard: Completed submissions; Last submission and barchart of Latest submissions
# Default blocks
Completed submissions and Last submission are statisistics blocks
Latest submissions block is a bar chart indicating trends for last days' data collection statistics. While activating this block you need to indicate the number - how many days you would like to include into this bar chart
# Additional blocks
More blocks can be addedd using Dashboard settings box.
Note
If Settings block is closed click settings button to open it.
# Progress pie
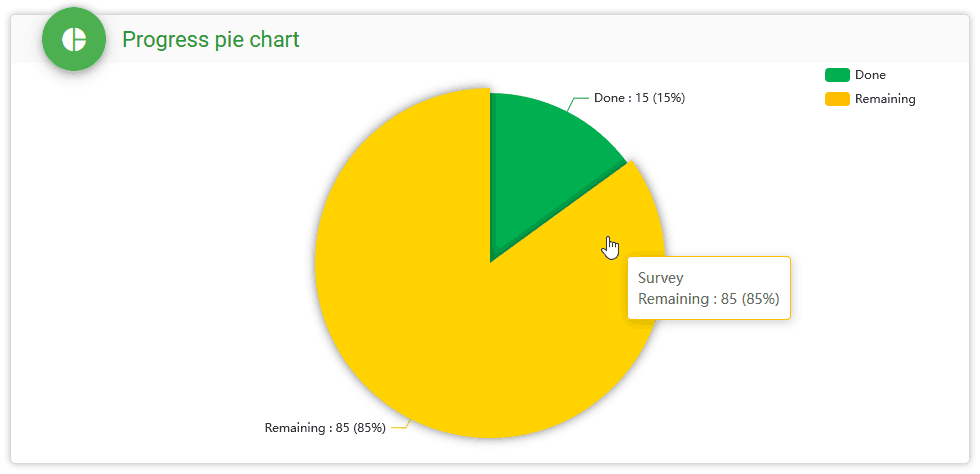
To add a progress pie block you need to select a table:
Then, you need to indicate your target - total number of submissions you planned to collect from the field. You find target field in the settings block. The default number is 100, change it accordingly.
# Daily progress
The daily progress block will inform about current progress and previous days' statistics in terms of data collection. In this block you can also see the start date of data collection progress and remaining surveys.
Here also you need to indicate your target - total number of submissions you planned to collect from the field. Default number is 100, you change it accordingly.
# Progress map
If you collect locational data in your survey form, selecting Progress map choice let you monitor data collection progress on the map in this Dashboard. This will also activate Mapboard section.
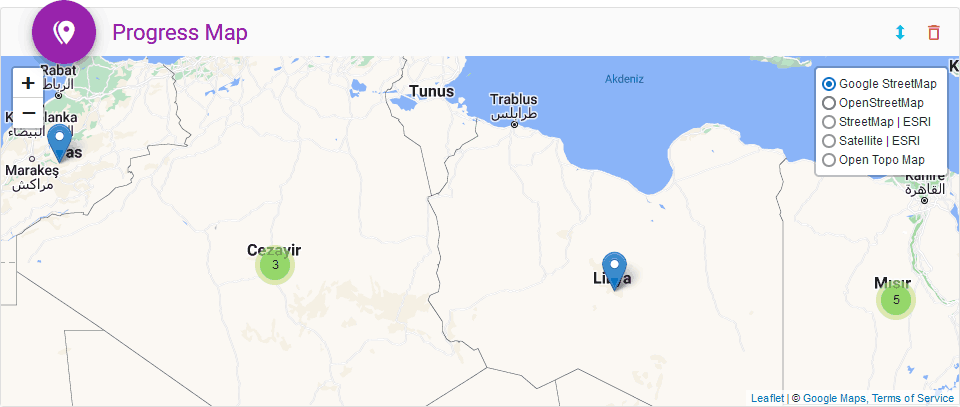
To add this block first selct Progress Map checkbox in Dashboard settings box
Then select select table where you have locational data and select Longitude and Latitude variables from your survey form.
Note
Dashboard presents you your survey data in near to real time. If you have any queries marked to be exclude from dataset in Query Builder, than the results of that query will not be included into the data of these blocks.
# Data Monitoring
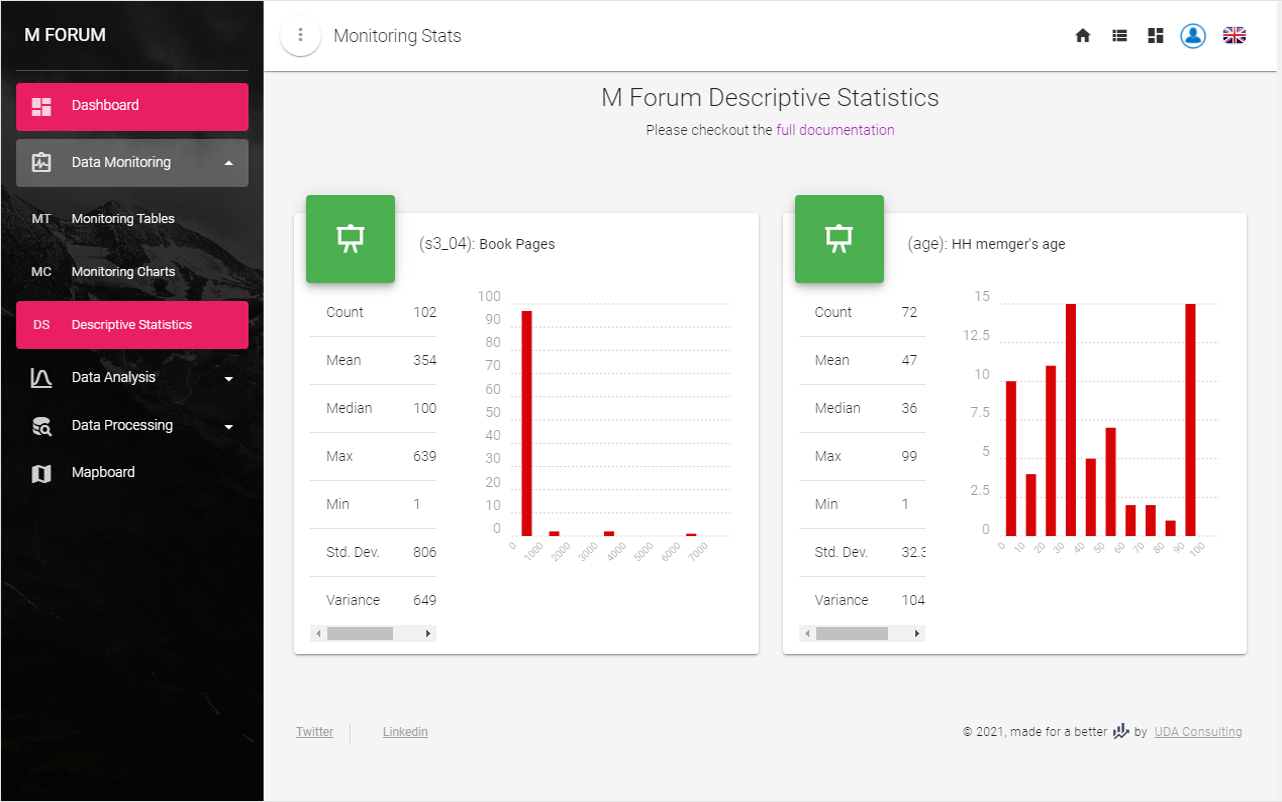
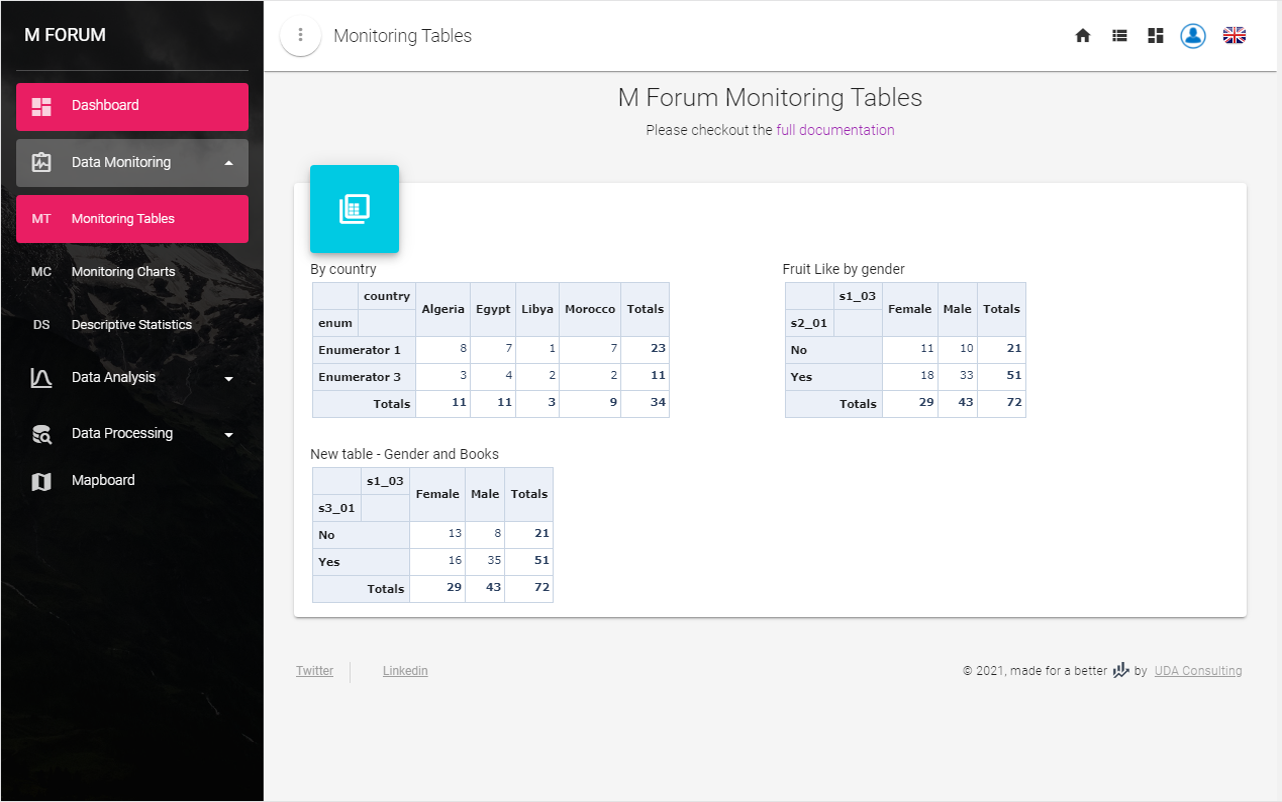
This section contains Monitoring tables and Descriptive statistics sections.
# Monitoring tables
# Descriptive statistics
