# Data Monitoring
This section contains Custom Monitoring tables and Descriptive statistics sections from survey questions.
# Monitoring Tables
If you want to monitor answers to different question and cross check responces you can disign a pivot table and save it for further monitoring.
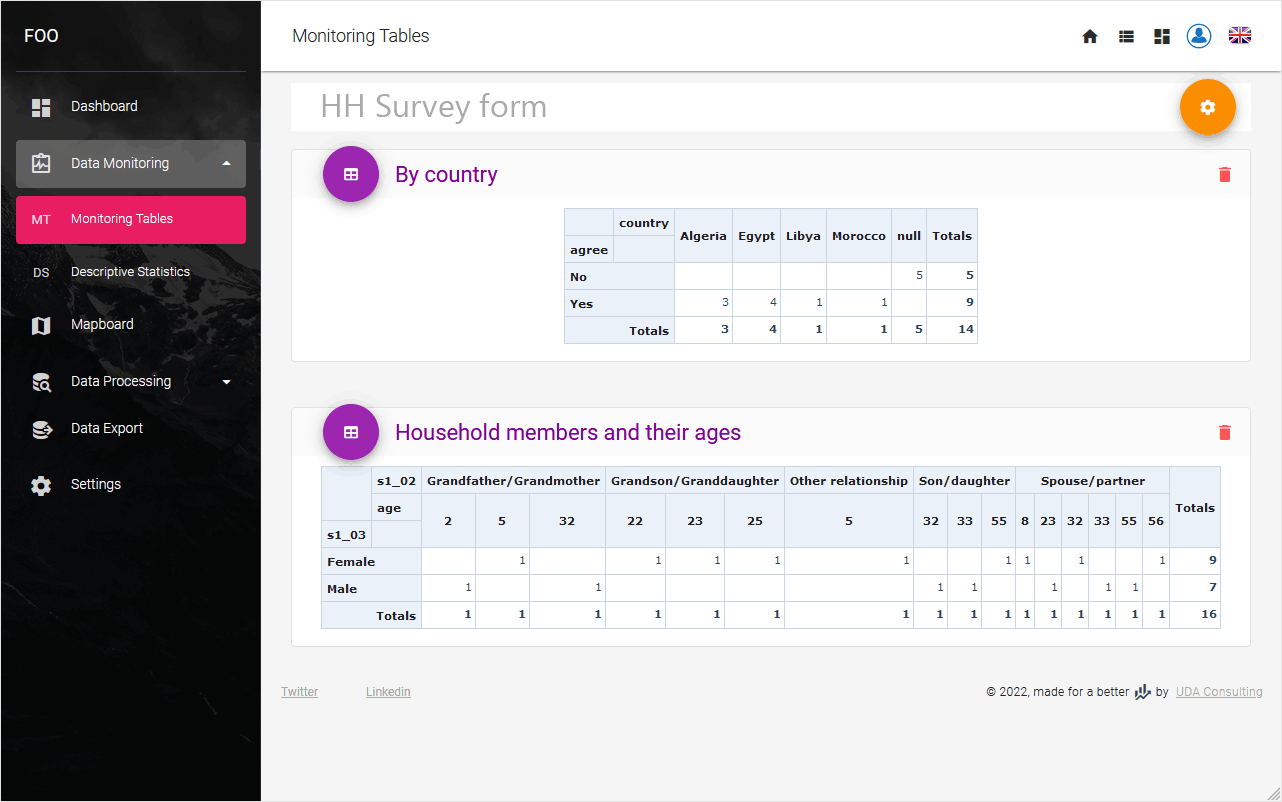
Use Data Monitoring settings box to prepare a pivot table
Note
If Settings block is closed click settings button to open it.
Pivot table provides dynamic cross analysis of questions. These analysis could be a cross table, different charts or heatmap tables, etc.
First select a table, then questions (e.g. variables) from that table
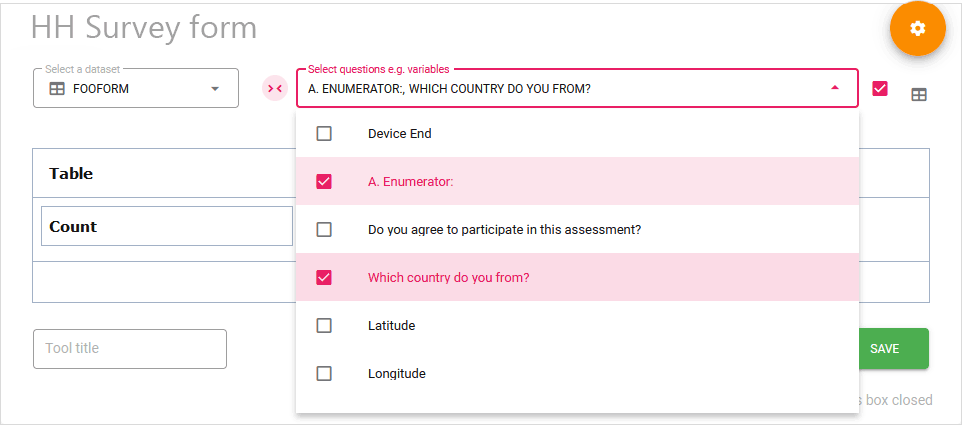
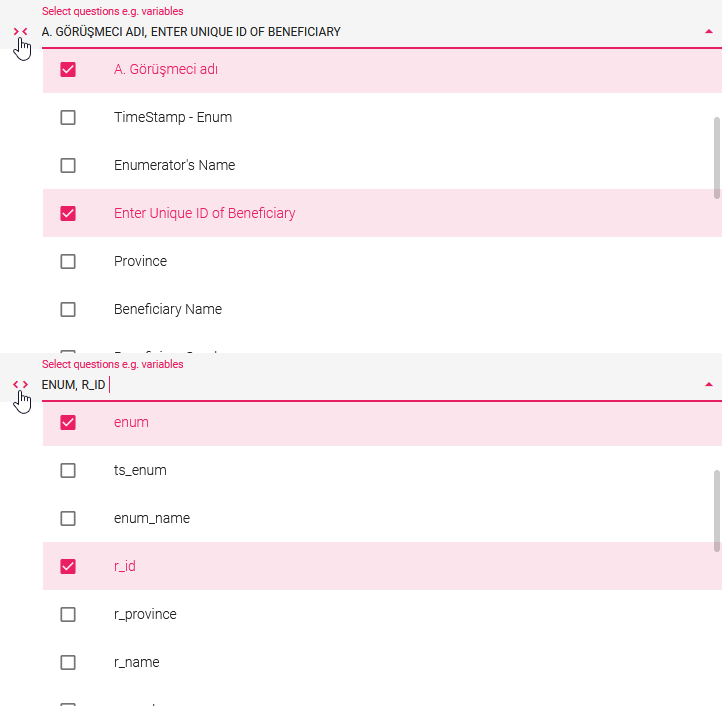
TIP
You can switch between question code (variable names) and question labels (variable labels) by clicking the button
DETAILS
You can save pivot table. First give a title to the table, then click Save button. The table will be added to this section:
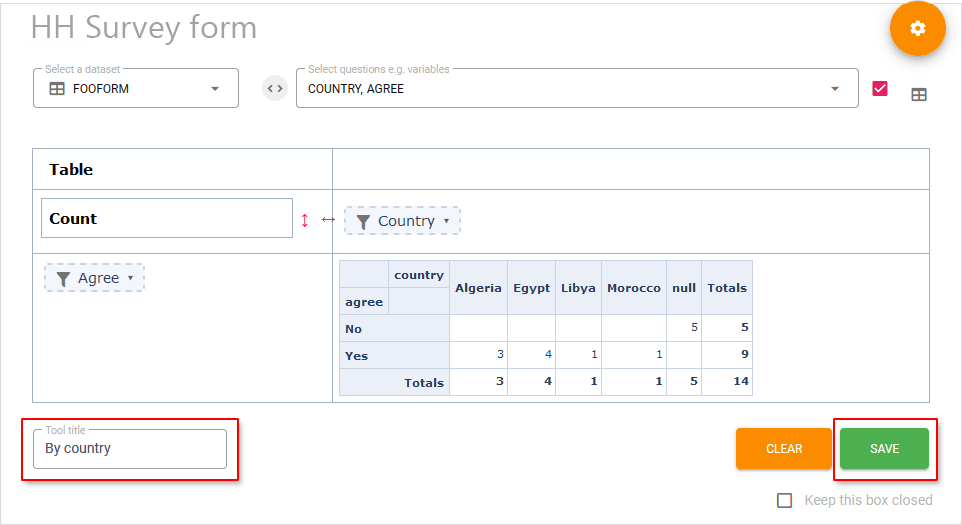
You can use pivot table's filter option to keep only those information you need to see on the final monitoring table:
Different type of calculations are available for your pivot tables Click default Count to change it.
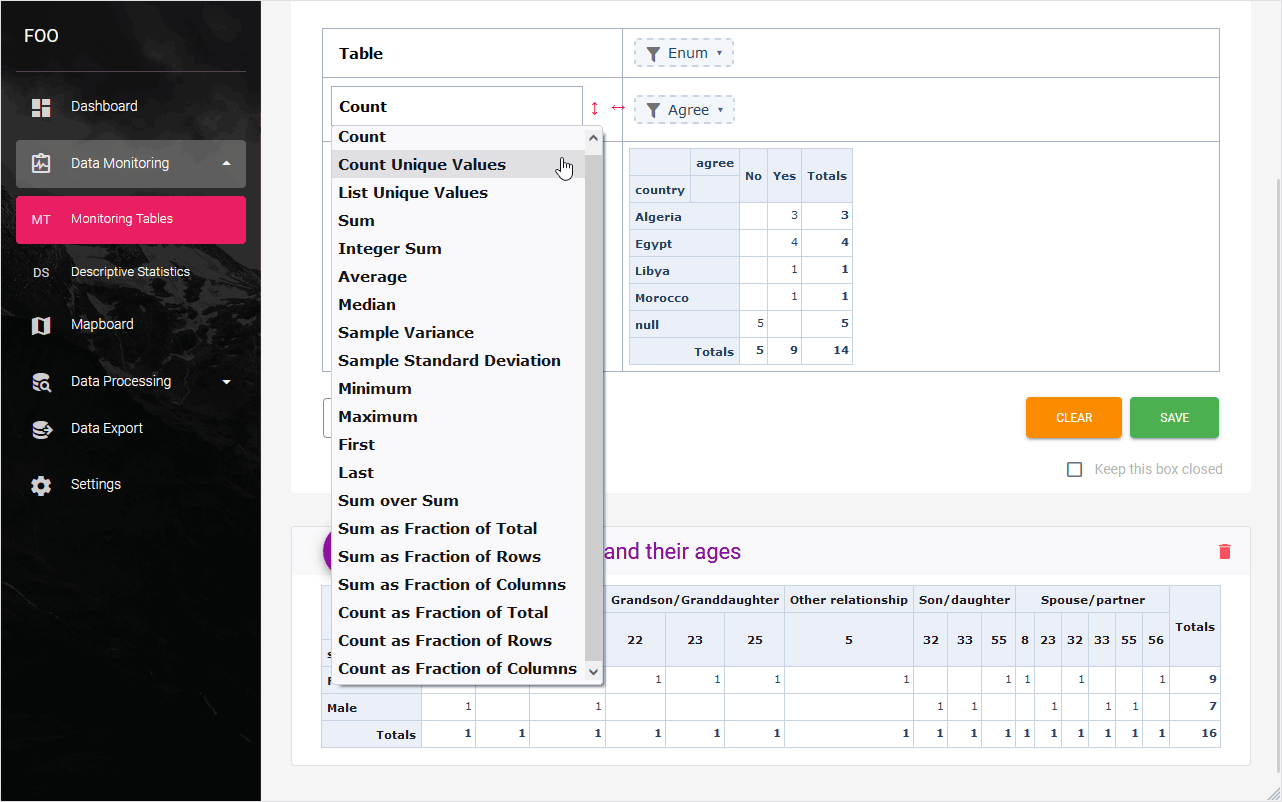
To change the type pivot table click the top left corner of the table and select one of the types from that list.
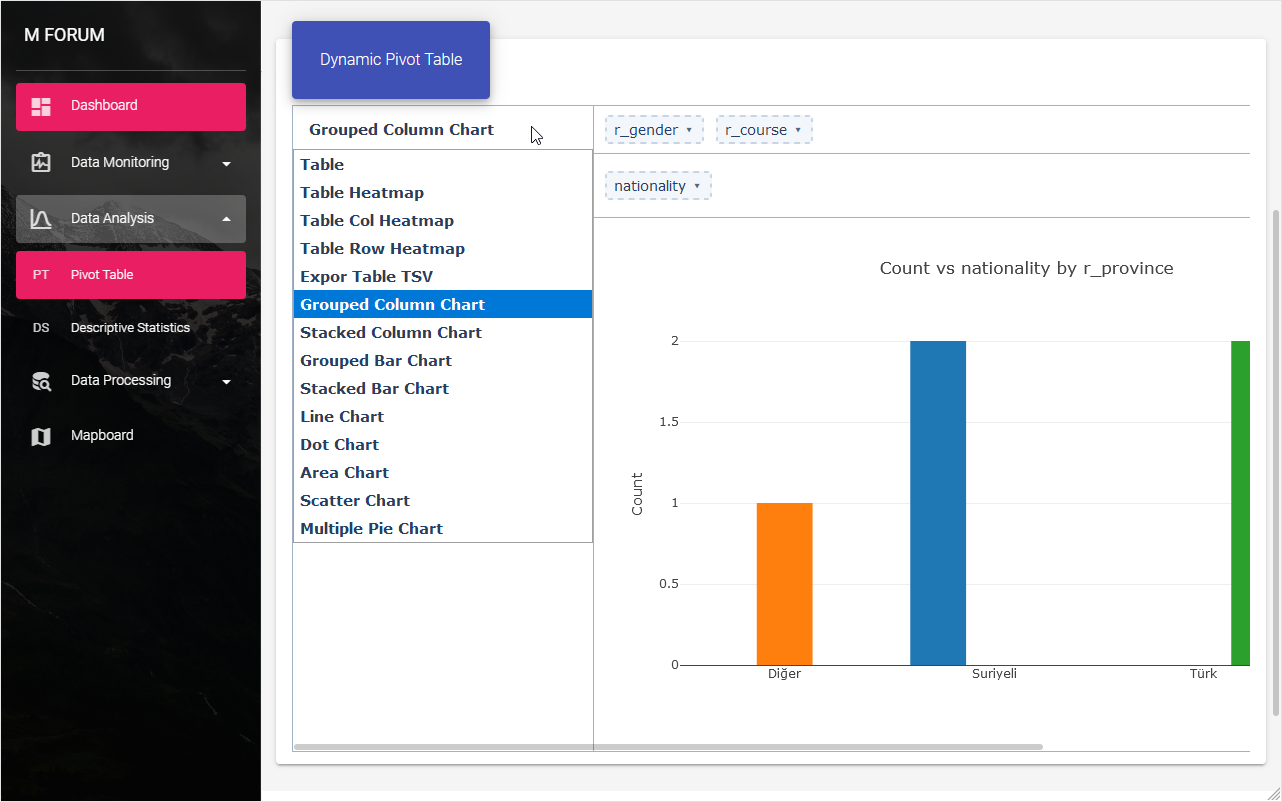
You can change table renderer to Heatmap. Click the top left corner of the pivot table and select one of the renderers from that list.
# Descriptive Statistics
This section lets you quickly get some statistical indicators (such as count, mean, median, maximum, minimum, standard deviation, variance, etc.) and a histogram - approximate representation of the distribution for questions with numeric values.
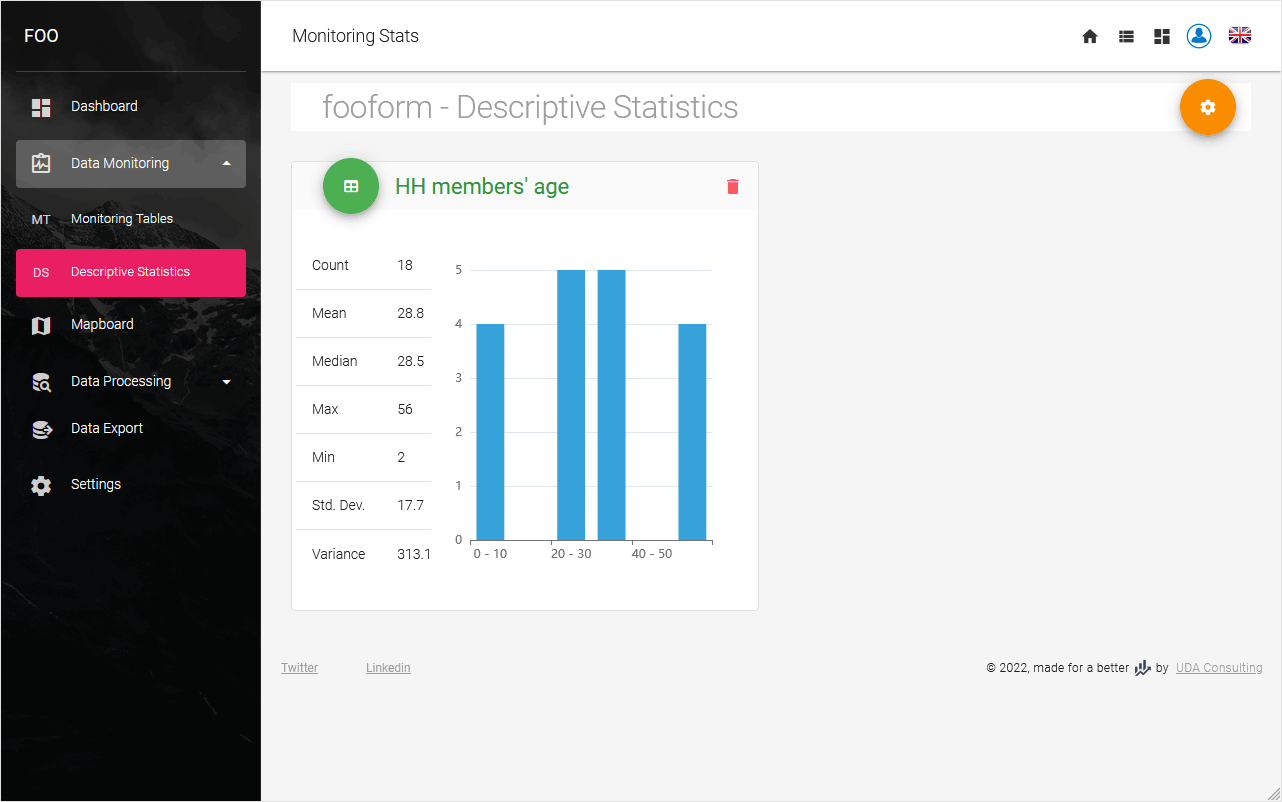
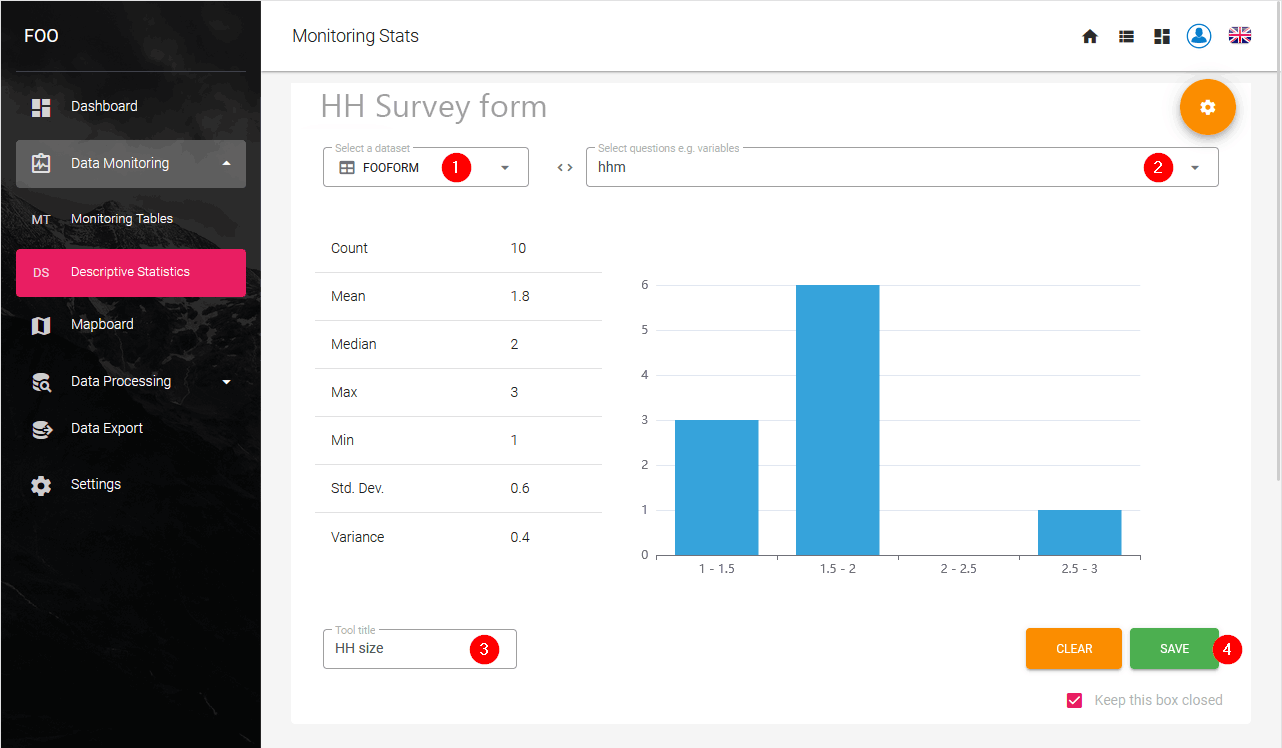
To add Descriptive Statistics block for further monitoring select 1) a table; 2) a question in settings box; 3) give a title for the block; and 4) click Save button.
Note
You can add Descriptive Statistics only for the questions where you collect numerical responses.